Web Vitals
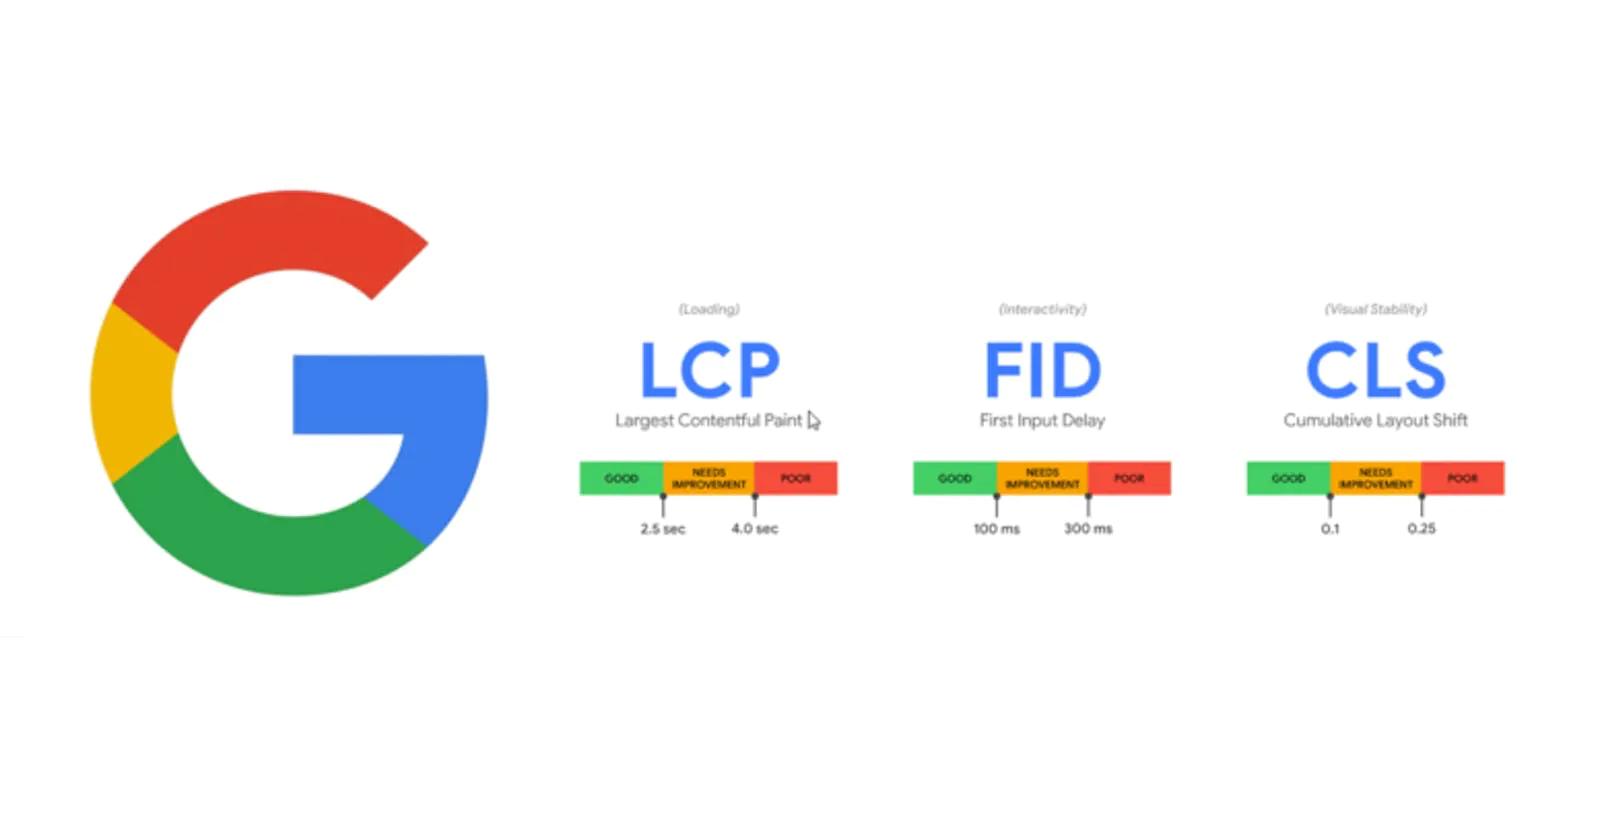
Web Vitals is an initiative created by Google to provide guidelines to measure the overall user experience quality of a website. Web Vitals can help developers identify opportunities for improvement after measuring the quality of a website. Google selected 3 measures as Core Web Vitals: LCP, FID, and CLS. Improving Core Web Vitals should make your website feel fast and seamless to users.
Largest Contentful Paint (LCP)
The Largest Contentful Paint (LCP) metric reports the render time of the largest image or text block visible within the web page, relative to when the page first started loading. The following elements are considered:
- img elements
- image elements inside an element
- video elements (the poster image is used)
- An element with a background image loaded via the url() function
- Block-level elements containing text nodes or other inline-level text elements children
In both of the timelines below, the largest element changes as content loads. In the first example, new content is added to the DOM and that changes what element is the largest. In the second example, the layout changes and content that was previously the largest is removed from the viewport. You can detect your LCP using Chrome browser, using Chrome Development Tools -> Performance tab.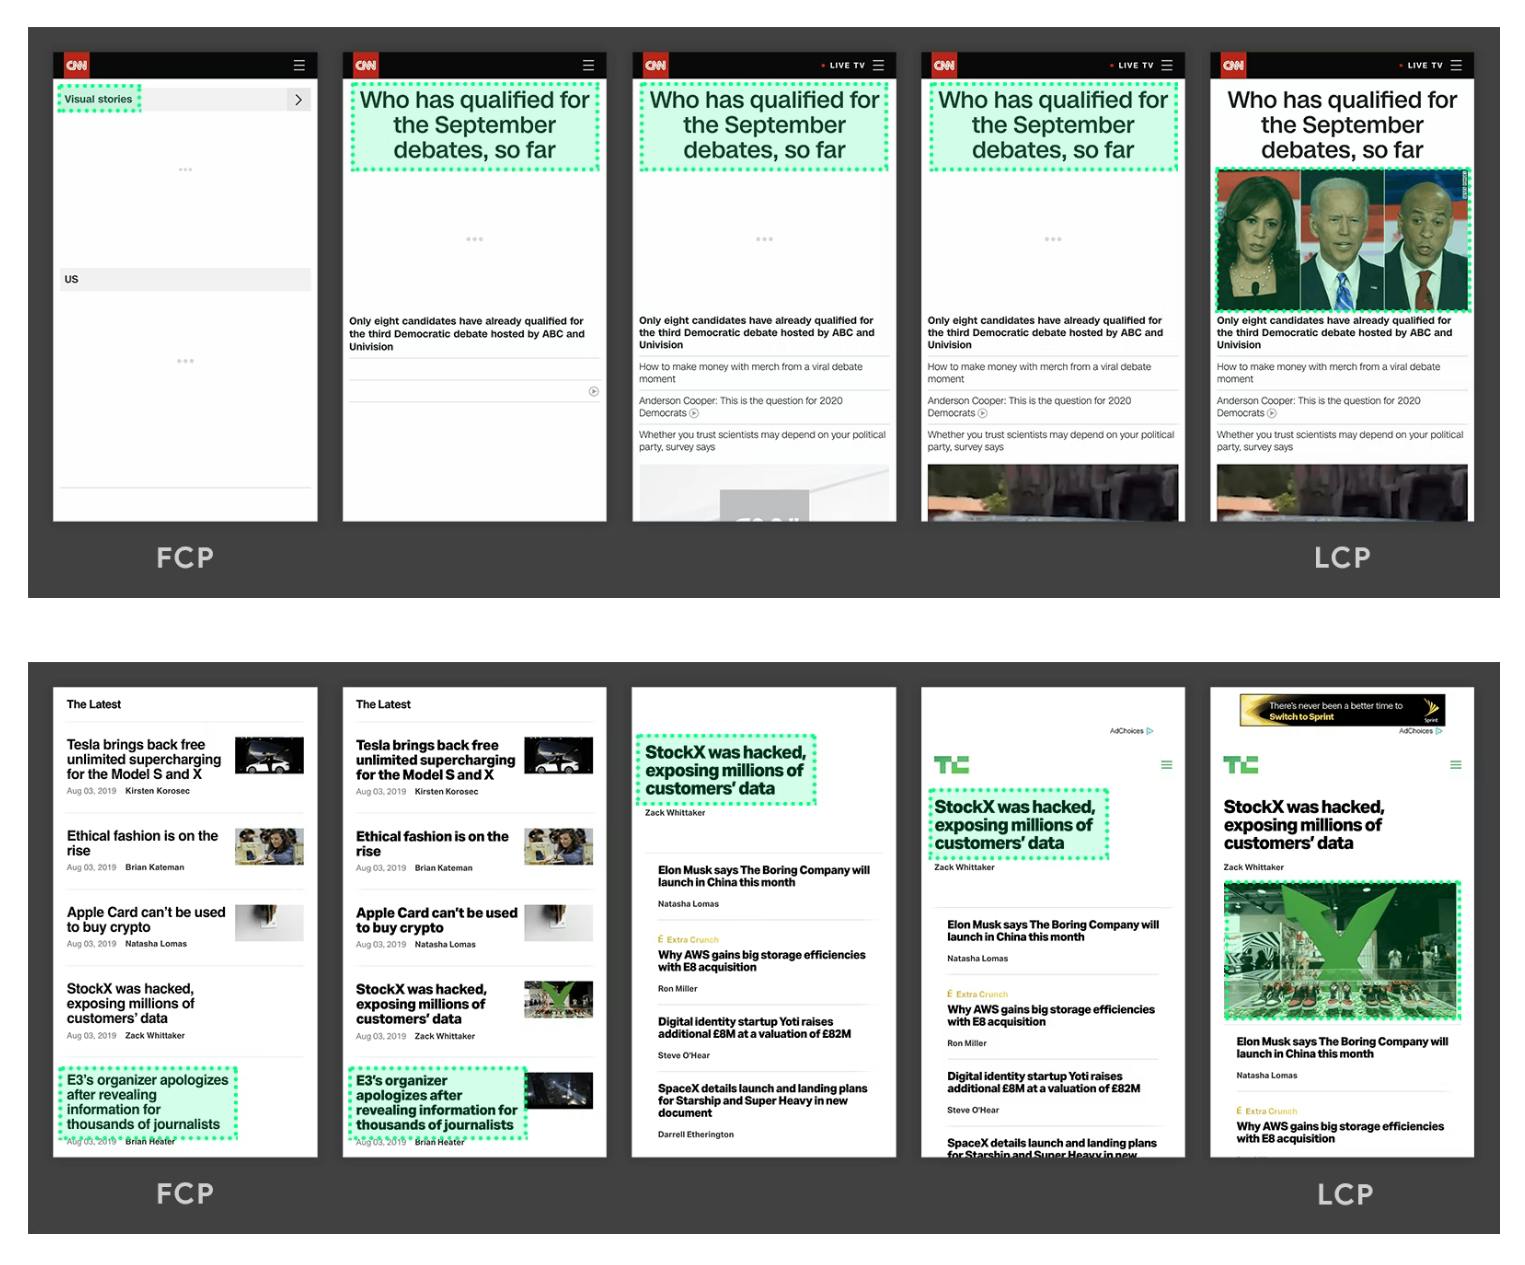
There are several methods to improve LCP. First, if your LCP is an image: check that your image is optimized and not scaled down by HTML. Try to use imageoptim to optimize images. You may also want to transition to the next generation of image formats such as WebP which are more performant.
Second, check for slow server response time: Low LCP can be caused by a slow server response time. If tools such as GTmetrix are telling you have a slow time to first byte and you are seeing a lot of waiting in the Waterfall chart, the slow LCP could be due to a slow server response. You may need more resources for your server or better hosting.
Third, render blocking assets: CSS and JavaScript can block a page from showing its LCP when they are blocking rendering of the page. If the CSS and JavaScript is referenced in the HEAD section of your HTML and are not tagged as asynchronous, the page will have to wait until they are downloaded and executed before anything is shown to the user. Look for opportunities to either remove these assets from the HEAD section of your page or to tag them as deferred or asynchronous.
First Input Delay (FID)
First Input Delay (FID) is an important, user-centric metric for measuring load responsiveness because it quantifies the experience users feel when trying to interact with unresponsive pages—a low FID helps ensure that the page is usable.
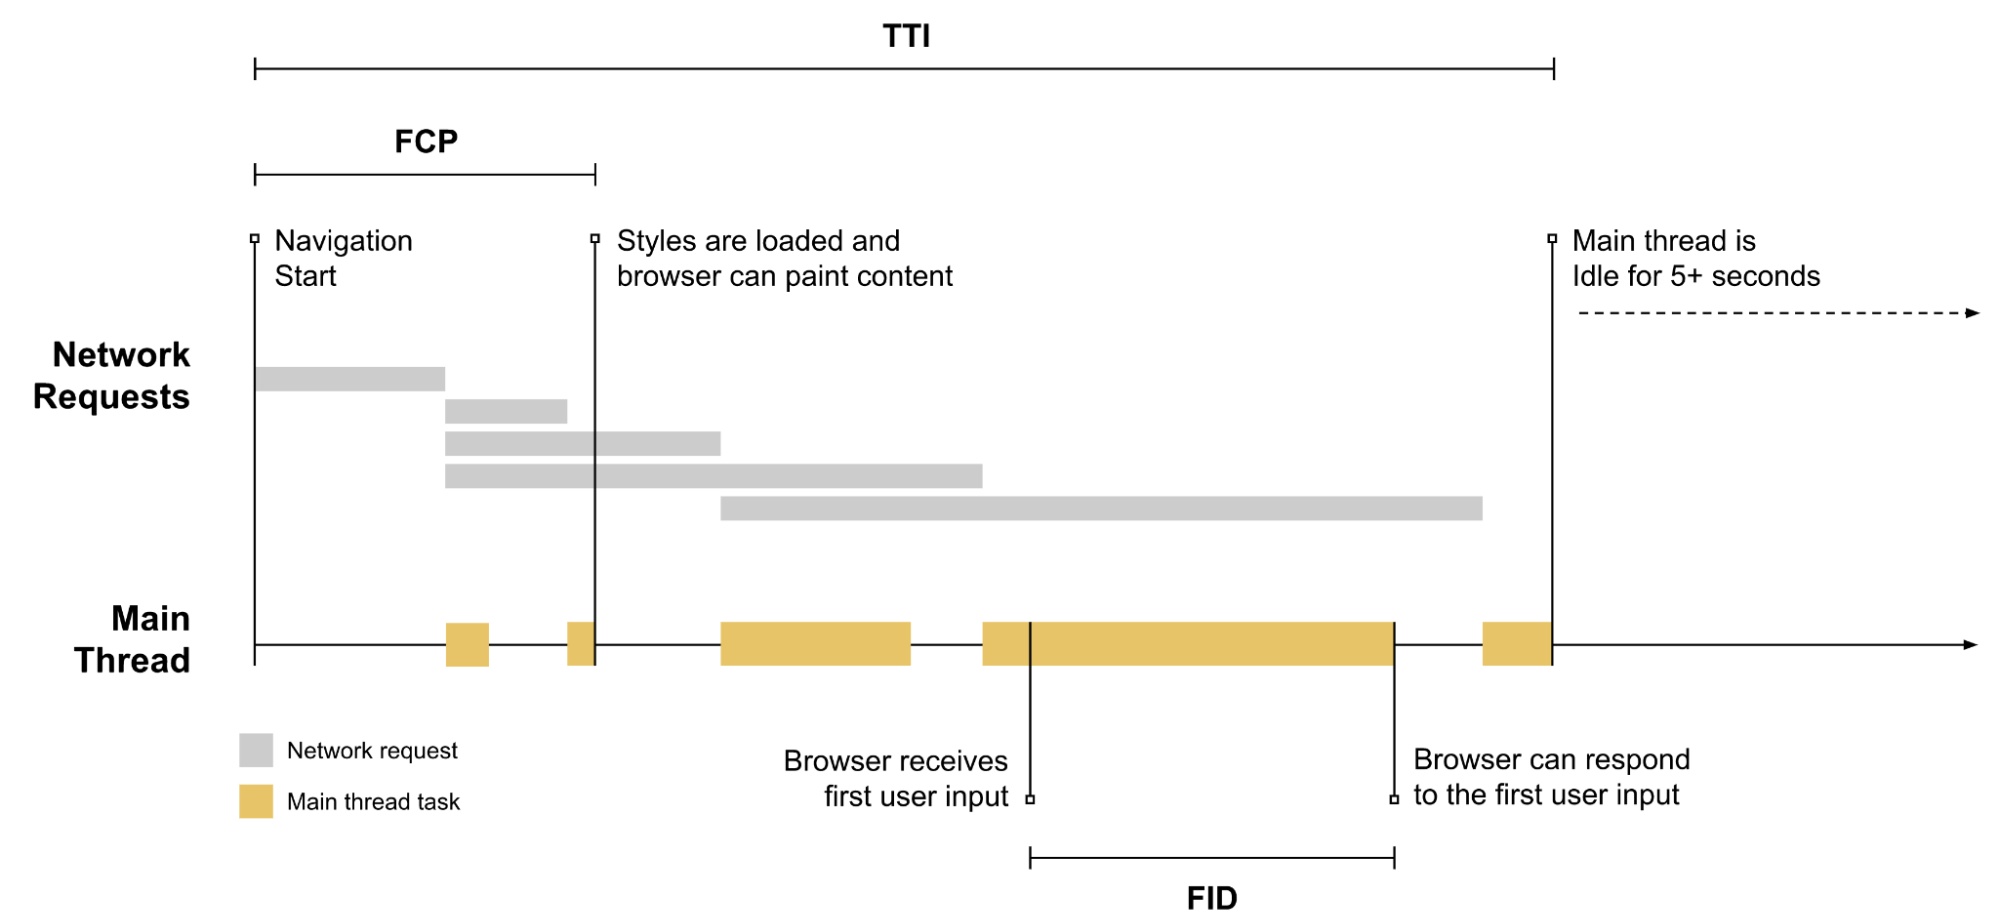
FID measures the time from when a user first interacts with a page (i.e. when they click a link, tap on a button, or use a custom, JavaScript-powered control) to the time when the browser is actually able to begin processing event handlers in response to that interaction. FID is a metric that measures a page’s responsiveness during load. As such, it only focuses on input events from discrete actions like clicks, taps, and key presses.
Other interactions, like scrolling and zooming, are continuous actions and have completely different performance constraints (also, browsers are often able to hide their latency by running them on a separate thread).
To provide a good user experience, sites should strive to have a First Input Delay of 100 milliseconds or less. To ensure you’re hitting this target for most of your users, a good threshold to measure is the 75th percentile of page loads, segmented across mobile and desktop devices.

In general, input delay (a.k.a. input latency) happens because the browser’s main thread is busy doing something else, so it can’t (yet) respond to the user. One common reason this might happen is the browser is busy parsing and executing a large JavaScript file loaded by your app. While it’s doing that, it can’t run any event listeners because the JavaScript it’s loading might tell it to do something else. FID only measures the “delay” in event processing. It does not measure the event processing time itself nor the time it takes the browser to update the UI after running event handlers. Below is a graph showing an example of how FID is calculated.
To optimize FID, you need to focus on:
- Breaking up Long Tasks
- Optimizing your page for interaction readiness
- Using a web worker
- Reducing JavaScript execution time
Breaking up long tasks: If you’ve already attempted to reduce the amount of JavaScript that loads on a single page, it can be useful to break down long-running code into smaller, asynchronous tasks. Long Tasks are JavaScript execution periods where users may find your UI unresponsive. Any piece of code that blocks the main thread for 50 ms or more can be characterized as a Long Task. Long Tasks are a sign of potential JavaScript bloat (loading and executing more than a user may need right now). Splitting up long tasks can reduce input delay on your site.
Optimize your page for interaction readiness: It is known that first-party script execution can delay interaction readiness. Hence, progressive loading of code and features can help spread this work out and improve interaction readiness. Also, server-side rendered apps may look like they’re getting pixels painted on the screen quickly, but beware of user interactions being blocked by large script executions. This can take several hundred milliseconds, sometimes even seconds, if route-based code splitting (libraries like React Lazy) is being used. Consider shifting more logic server-side or generating more content statically during build time.
Moreover, data-fetching can impact many aspects of interaction readiness. Waiting on a waterfall of cascading fetches (e.g. JavaScript and data fetches for components) can impact interaction latency. Aim to minimize a reliance on cascading data fetches. Large inline data stores can push out HTML parsing time and impact both paint and interaction metrics. Aim to minimize how much data needs to be post-processed on the client-side.
Finally, third-party script execution can delay interaction latency too. Many sites include third-party tags and analytics which can keep the network busy and make the main thread periodically unresponsive, impacting interaction latency. Explore on-demand loading of third-party code (e.g. maybe don’t load those below-the-fold ads until they’re scrolled closer to the viewport). In some cases, third-party scripts can pre-empt first-party ones in terms of priority and bandwidth on the main thread, also delaying how soon a page is interaction-ready. Attempt to prioritize loading what you believe offers the greatest value to users first.
Use of a web worker A blocked main thread is one of the main causes of input delay. Web workers make it possible to run JavaScript on a background thread. Moving non-UI operations to a separate worker thread can cut down main thread blocking time and consequently improve FID. Consider using the following libraries to make it easier to use web workers on your site:
- Comlink: A helper library that abstracts postMessage and makes it easier to use
- Workway: A general purpose web worker exporter
- Workerize: Move a module into a web worker
Reduce JavaScript execution time
- To reduce the amount of JavaScript executed on your page:
- Defer unused JavaScript
- Code-split your bundle into multiple chunks
- Defer any non-critical JavaScript, including third-party scripts, using async or defer
- Minimize unused polyfills
Cumulative Layout Shift (CLS)
Have you ever been reading an article online when something suddenly changes on the page? Without warning, the text moves, and you’ve lost your place. Or even worse: you’re about to tap a link or a button, but in the instant before your finger lands—BOOM—the link moves, and you end up clicking something else!
Unexpected movement of page content usually happens because resources are loaded asynchronously or DOM elements get dynamically added to the page above existing content. The culprit might be an image or video with unknown dimensions, a font that renders larger or smaller than its fallback, or a third-party ad or widget that dynamically resizes itself.
CLS is a measure of the largest burst of layout shift scores for every unexpected layout shift that occurs during the entire lifespan of a page. A layout shift occurs any time a visible element changes its position from one rendered frame to the next. To calculate the layout shift score, the browser looks at the viewport size and the movement of unstable elements in the viewport between two rendered frames. The layout shift score is a product of two measures of that movement: the impact fraction and the distance fraction.

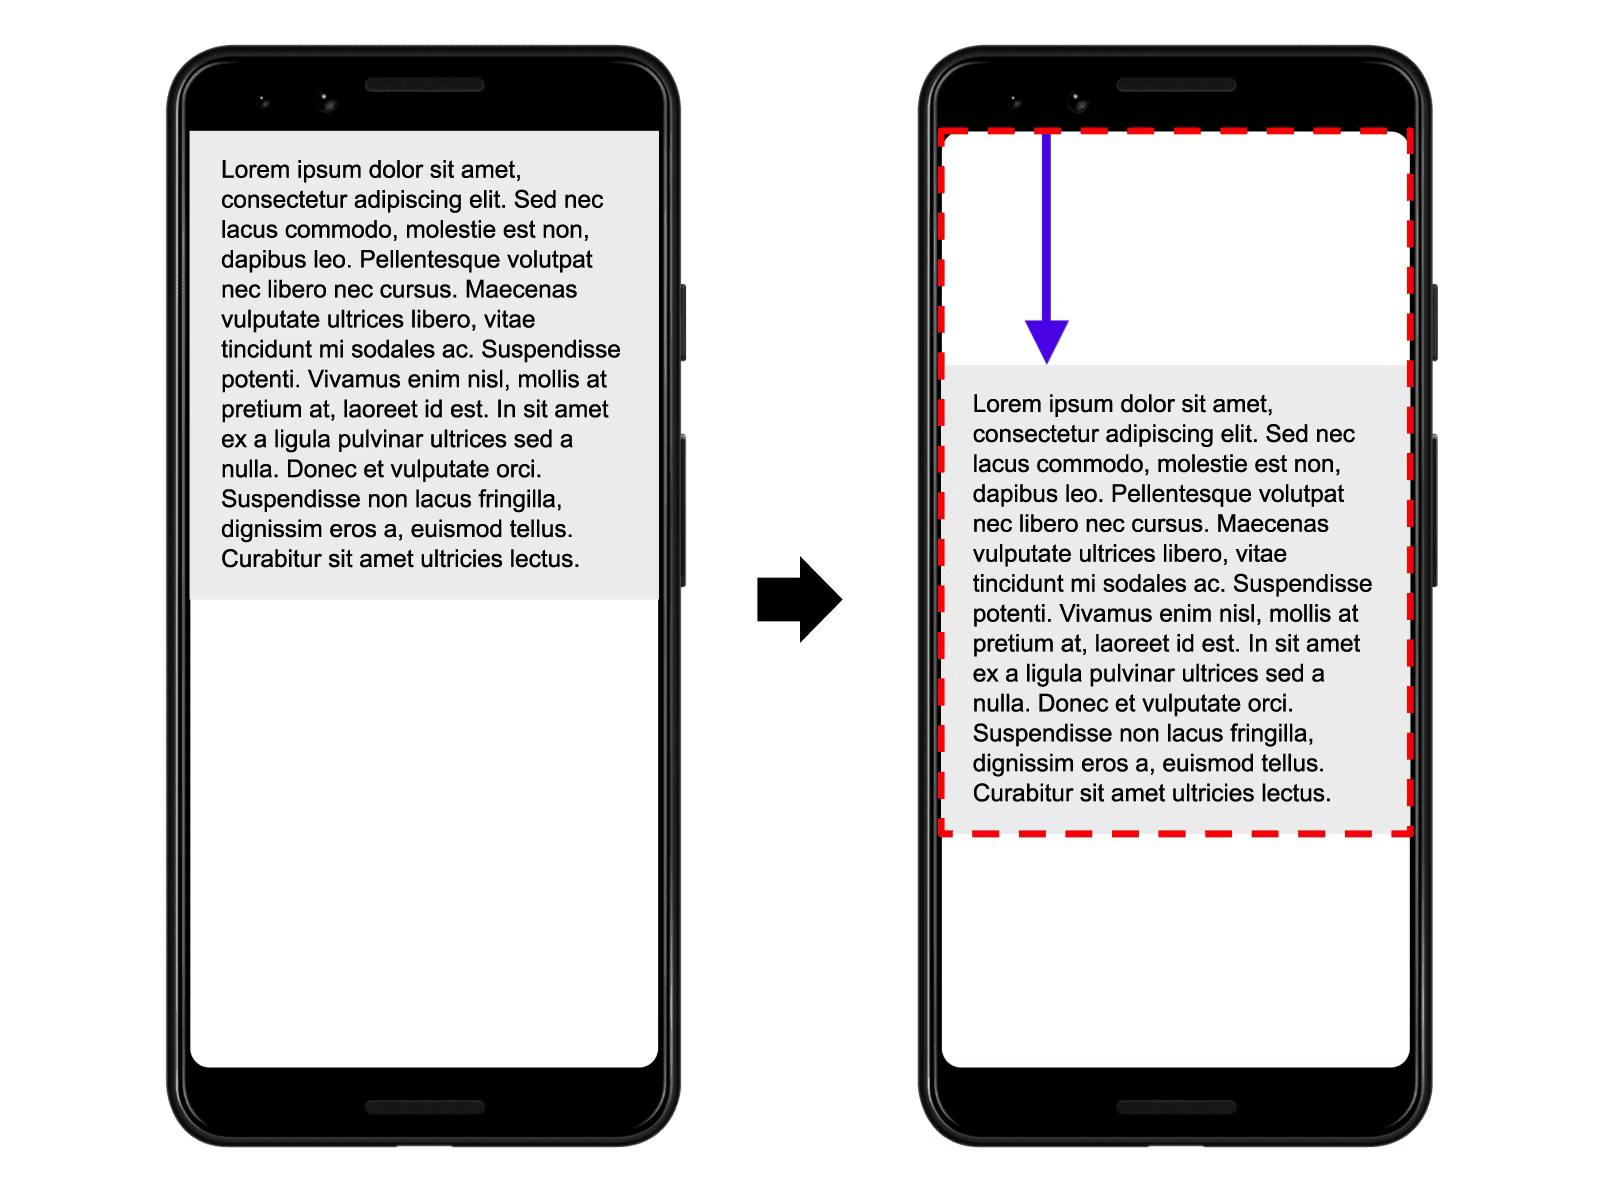
CLS – Impact Fraction In the image on the right, there’s an element that takes up half of the viewport in one frame. Then, in the next frame, the element shifts down by 25% of the viewport height. The red, dotted rectangle indicates the union of the element’s visible area in both frames, which, in this case, is 75% of the total viewport, so its impact fraction is 0.75.
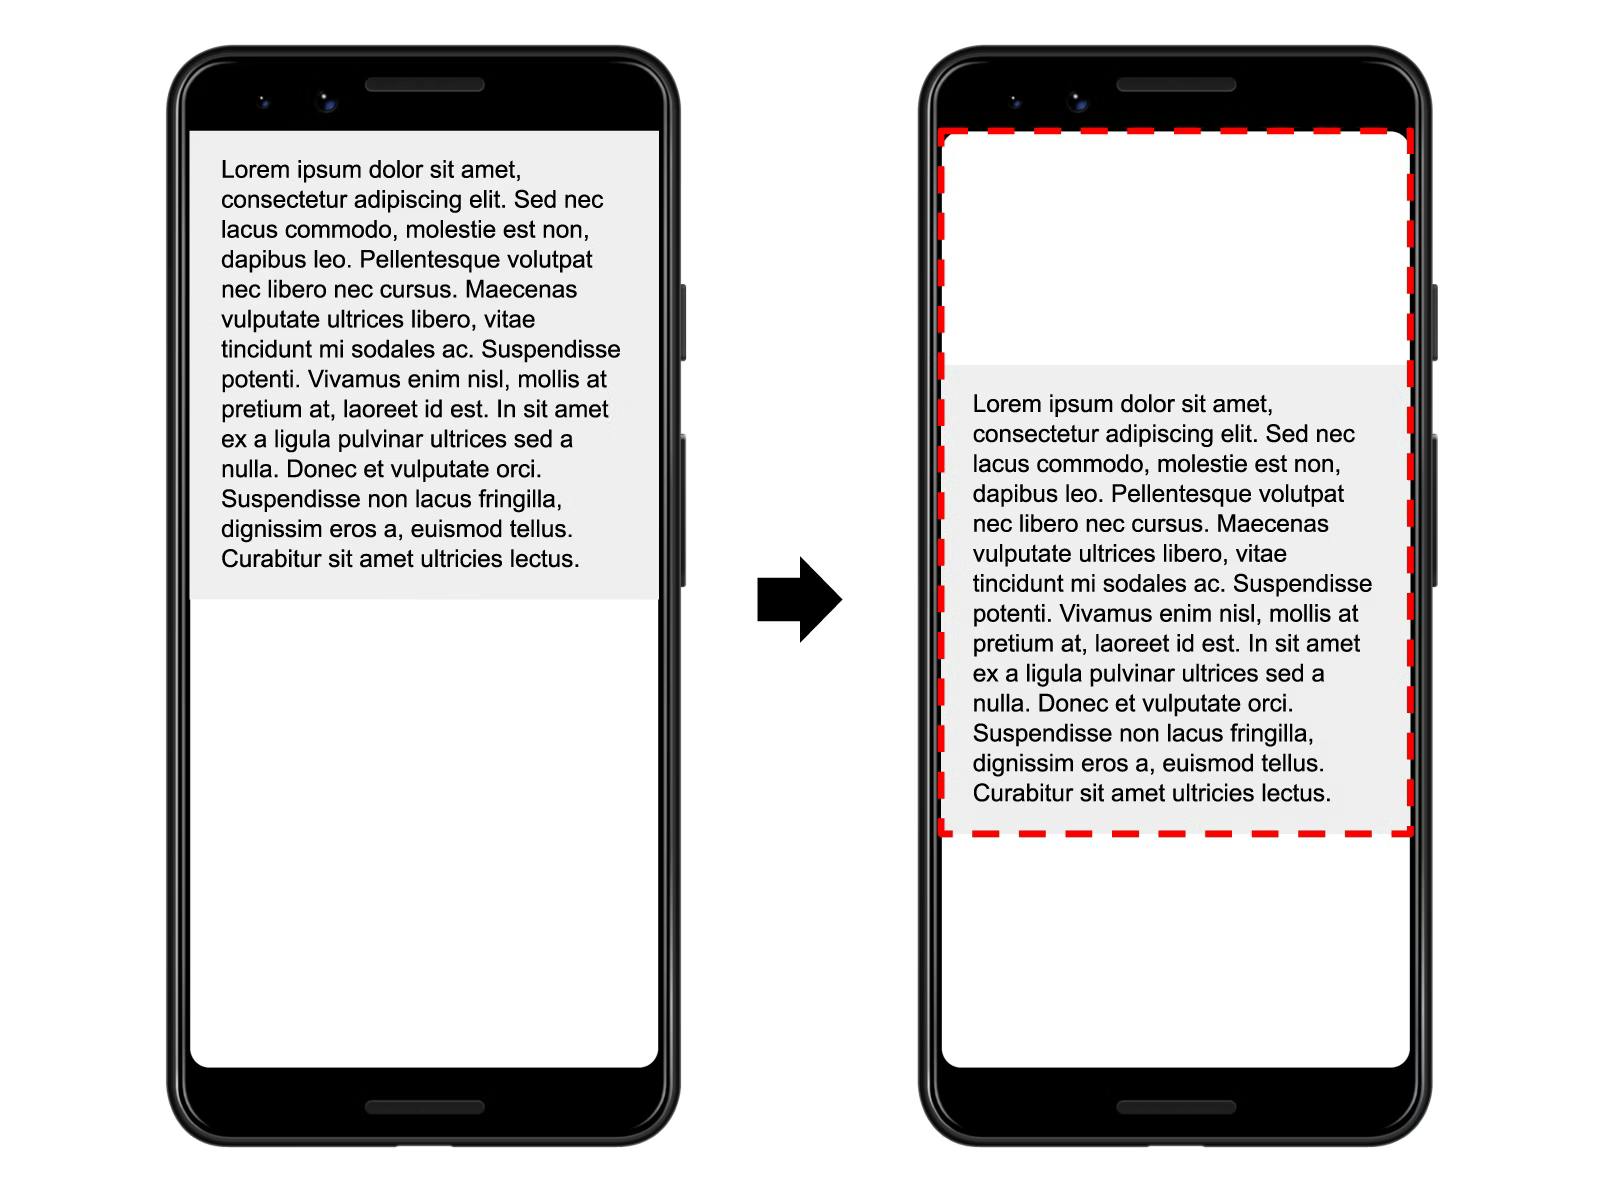
CLS – Distance Fraction In the example above, the largest viewport dimension is the height, and the unstable element has moved by 25% of the viewport height, which makes the distance fraction 0.25. So, in this example the impact fraction is 0.75 and the distance fraction is 0.25, so the layout shift score is 0.75 * 0.25 = 0.1875
To provide a good user experience, sites should strive to have a CLS score of 0.1 or less. To ensure you’re hitting this target for most of your users, a good threshold to measure is the 75th percentile of page loads, segmented across mobile and desktop devices.

The most common causes of a poor CLS are:
- Images without dimensions
- Ads, embeds, and iframes without dimensions
- Dynamically injected content
- Web Fonts causing FOIT/FOUT
- Actions waiting for a network response before updating DOM
Other Web Vitals
- Time to First Byte (TTFB)
- First Contentful Paint (FCP)
- Total Blocking Time (TBT)
- Time to Interactive (TTI)
Time To First Byte (TTFB) TTFB is a metric that measures the time between the request for a resource and when the first byte of a response begins to arrive. TTFB is the sum of the following request phases:
- Redirect time
- Service worker startup time (if applicable)
- DNS lookup
- Connection and TLS negotiation
- Request, up until the point at which the first byte of the response has arrived
Reducing latency in connection setup time and on the backend will contribute to a lower TTFB. Improving TTFB is largely dependent on your hosting provider and backend application stack. High TTFB values could be due to one or more of the following problems:
- Hosting services with inadequate infrastructure to handle high traffic loads
- Web servers with insufficient memory that can lead to thrashing
- Unoptimized database tables
- Suboptimal database server configuration
First Contentful Paint (FCP) The First Contentful Paint (FCP) metric measures the time from when the page starts loading to when any part of the page’s content is rendered on the screen. For this metric, “content” refers to text, images (including background images), elements, or non-white elements.
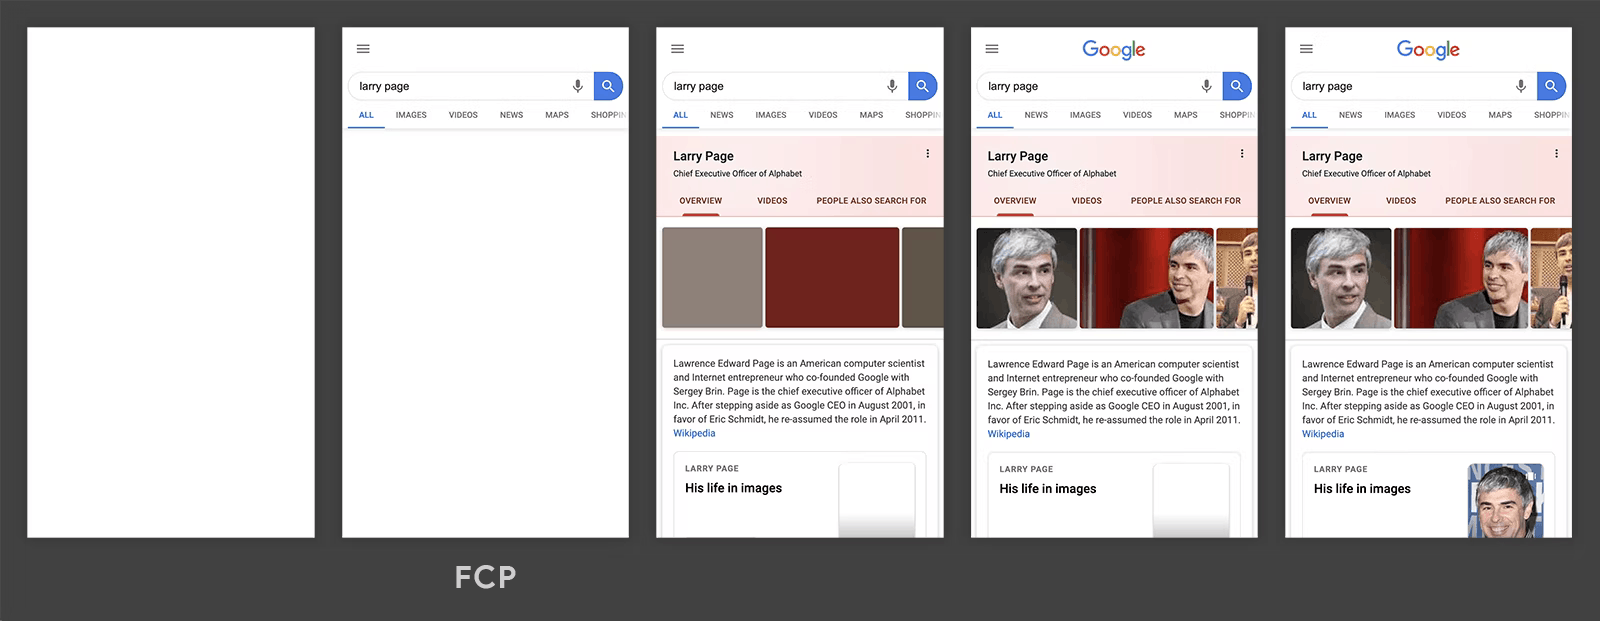
To provide a good user experience, sites should strive to have a First Contentful Paint of 1.8 seconds or less. To ensure you’re hitting this target for most of your users, a good threshold to measure is the 75th percentile of page loads, segmented across mobile and desktop devices.

To learn how to improve FCP in general (for any site), refer to the following performance guides:
- Eliminate render-blocking resources
- Minify CSS
- Remove unused CSS
- Preconnect to required origins
- Reduce server response times (TTFB)
- Avoid multiple page redirects
- Preload key requests
- Avoid enormous network payloads
- Serve static assets with an efficient cache policy
- Avoid an excessive DOM size
- Minimize critical request depth
- Ensure text remains visible during webfont load
- Keep request counts low and transfer sizes small
Total Blocking Time (TBT) The Total Blocking Time (TBT) metric measures the total amount of time between First Contentful Paint (FCP) and Time to Interactive (TTI) where the main thread was blocked for long enough to prevent input responsiveness.
The main thread is considered “blocked” any time there’s a Long Task—a task that runs on the main thread for more than 50 milliseconds (ms). We say the main thread is “blocked” because the browser cannot interrupt a task that’s in progress. So in the event that a user does interact with the page in the middle of a long task, the browser must wait for the task to finish before it can respond.
If the task is long enough (e.g. anything above 50 ms), it’s likely that the user will notice the delay and perceive the page as sluggish or janky.
The blocking time of a given long task is its duration in excess of 50 ms. And the total blocking time for a page is the sum of the blocking time for each long task that occurs between FCP and TTI.
To provide a good user experience, sites should strive to have a Total Blocking Time of less than 200 milliseconds when tested on average mobile hardware.
To learn how to improve TBT in general (for any site), refer to the following performance guides:
- Reduce the impact of third-party code
- Reduce JavaScript execution time
- Minimize main thread work
- Keep request counts low and transfer sizes small
Time to Interactive (TTI) The TTI metric measures the time from when the page starts loading to when its main sub-resources have loaded and it is capable of reliably responding to user input quickly.
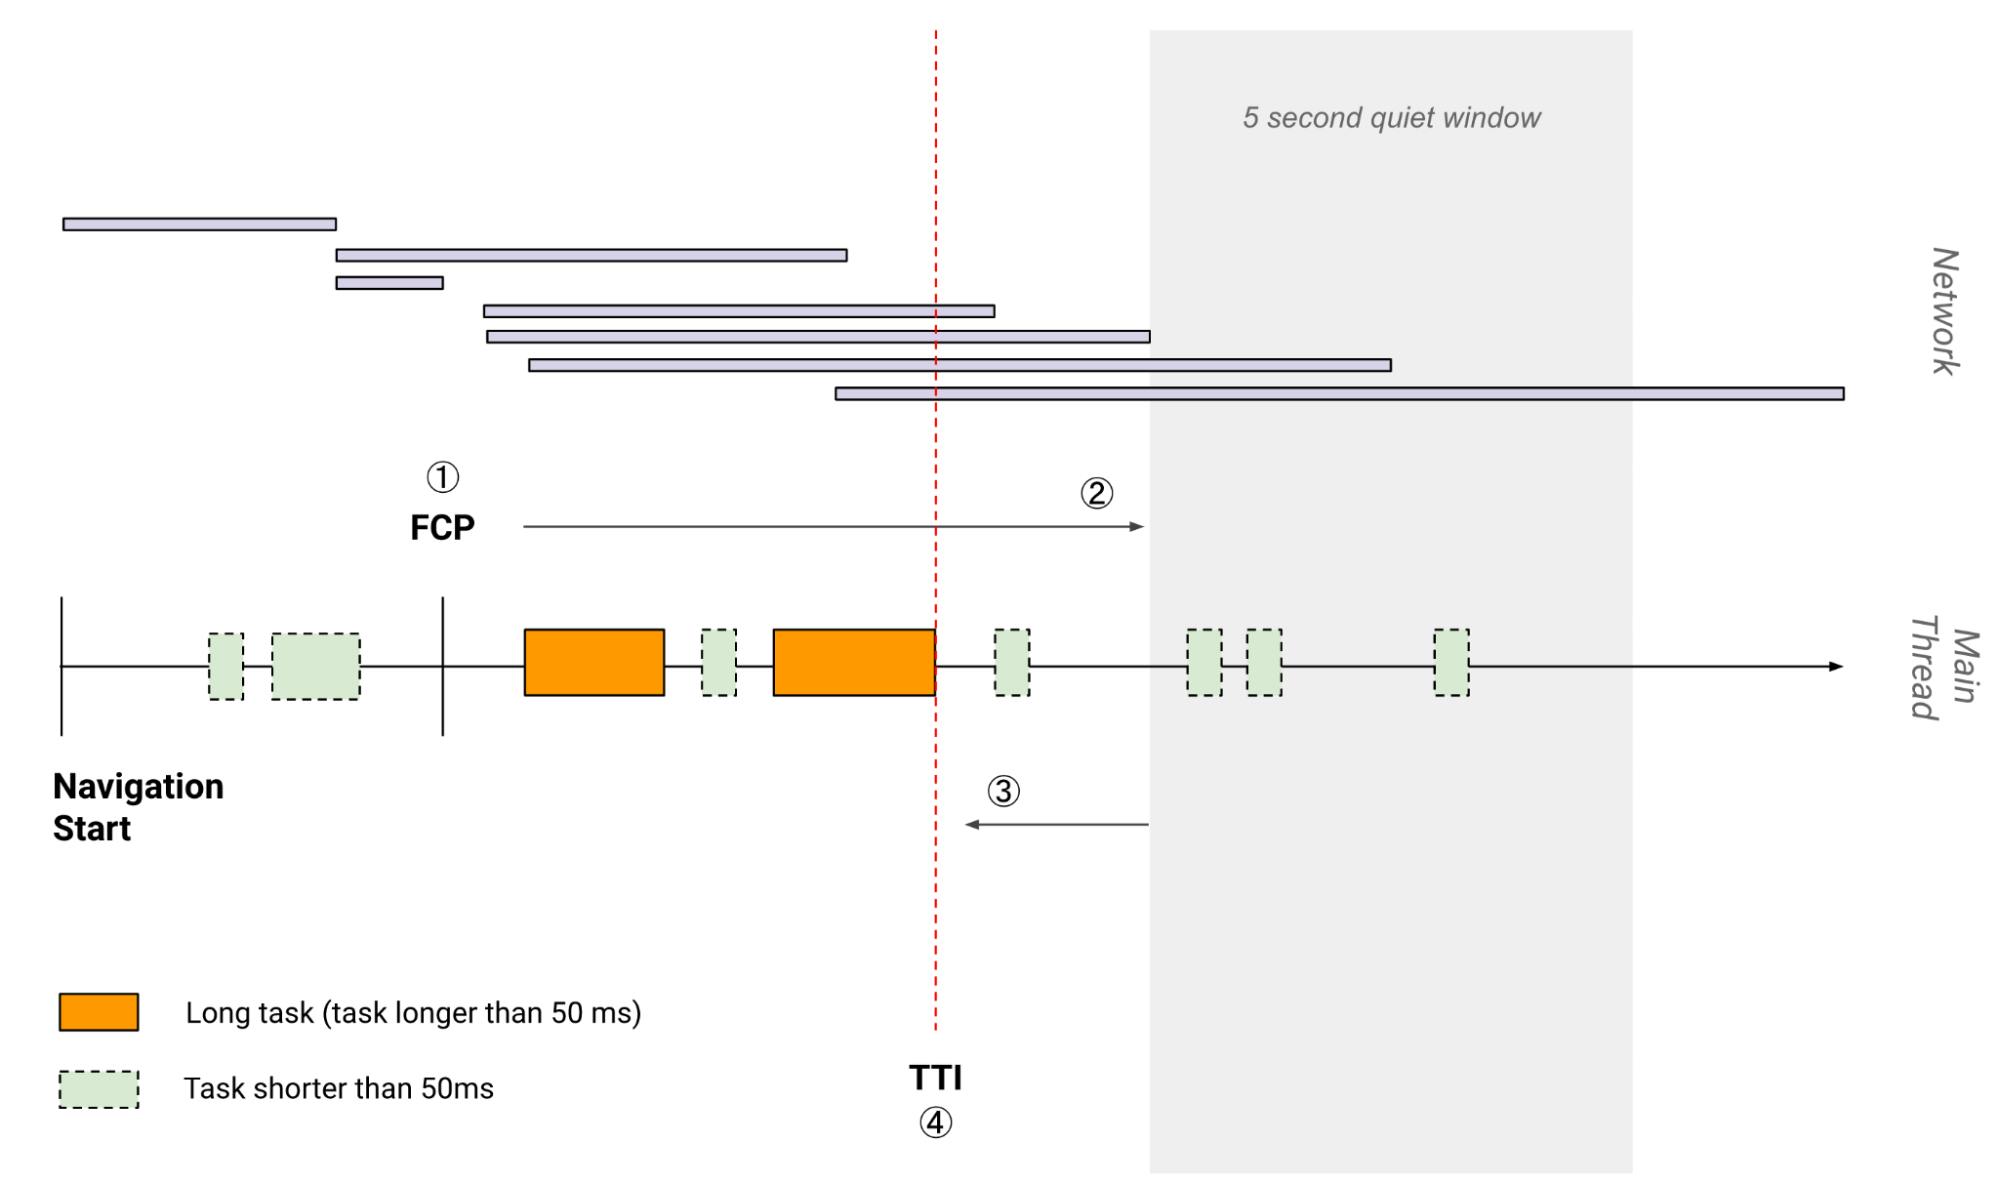
To learn how to improve TTI in general (for any site), refer to the following performance guides:
- Minify JavaScript
- Preconnect to required origins
- Preload key requests
- Reduce the impact of third-party code
- Minimize critical request depth
- Reduce JavaScript execution time
- Minimize main thread work
- Keep request counts low and transfer sizes small
Reference: web.dev/vitals
